Introduction to Vectors#
Many simple measurements can be expressed as scalar values, or single numeric values. Common examples include height and weight. For example, a person may be 60 years old, or a street may be 10 m wide, or a piece of paper may be 8.5 inches wide and 11 inches long.
Some quantities, however, are more complicated. For example, during bad weather, you may notice that there are strong winds. These winds not only have a specific speed, but they also blow in a specific compass direction [Klink, 1998]. In this case, we have multiple numbers which represent the measurement! We can consider the wind velocity as having a magnitude (the speed) and a direction. Together, these values form a vector. Vectors group together multiple numbers to provide more complicated meanings.
Vector Coordinate Systems#
And now the all-important question: how do we represent these vectors?
Cartesian Coordinates#
In 2D or 3D, as vectors are directed quantities, they can be represented using arrows [1]. A 3D vector has 3 components, indicating the arrow length along the x, y and z-axes.
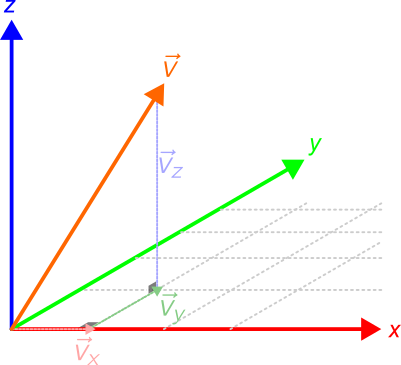
These components define the Cartesian coordinates of points and vectors. These three components together encode the magnitude and the direction. While these numbers have a very clear definition and are easy to store, this Cartesian coordinate representation combines the magnitude and the direction together.
Spherical Coordinates#
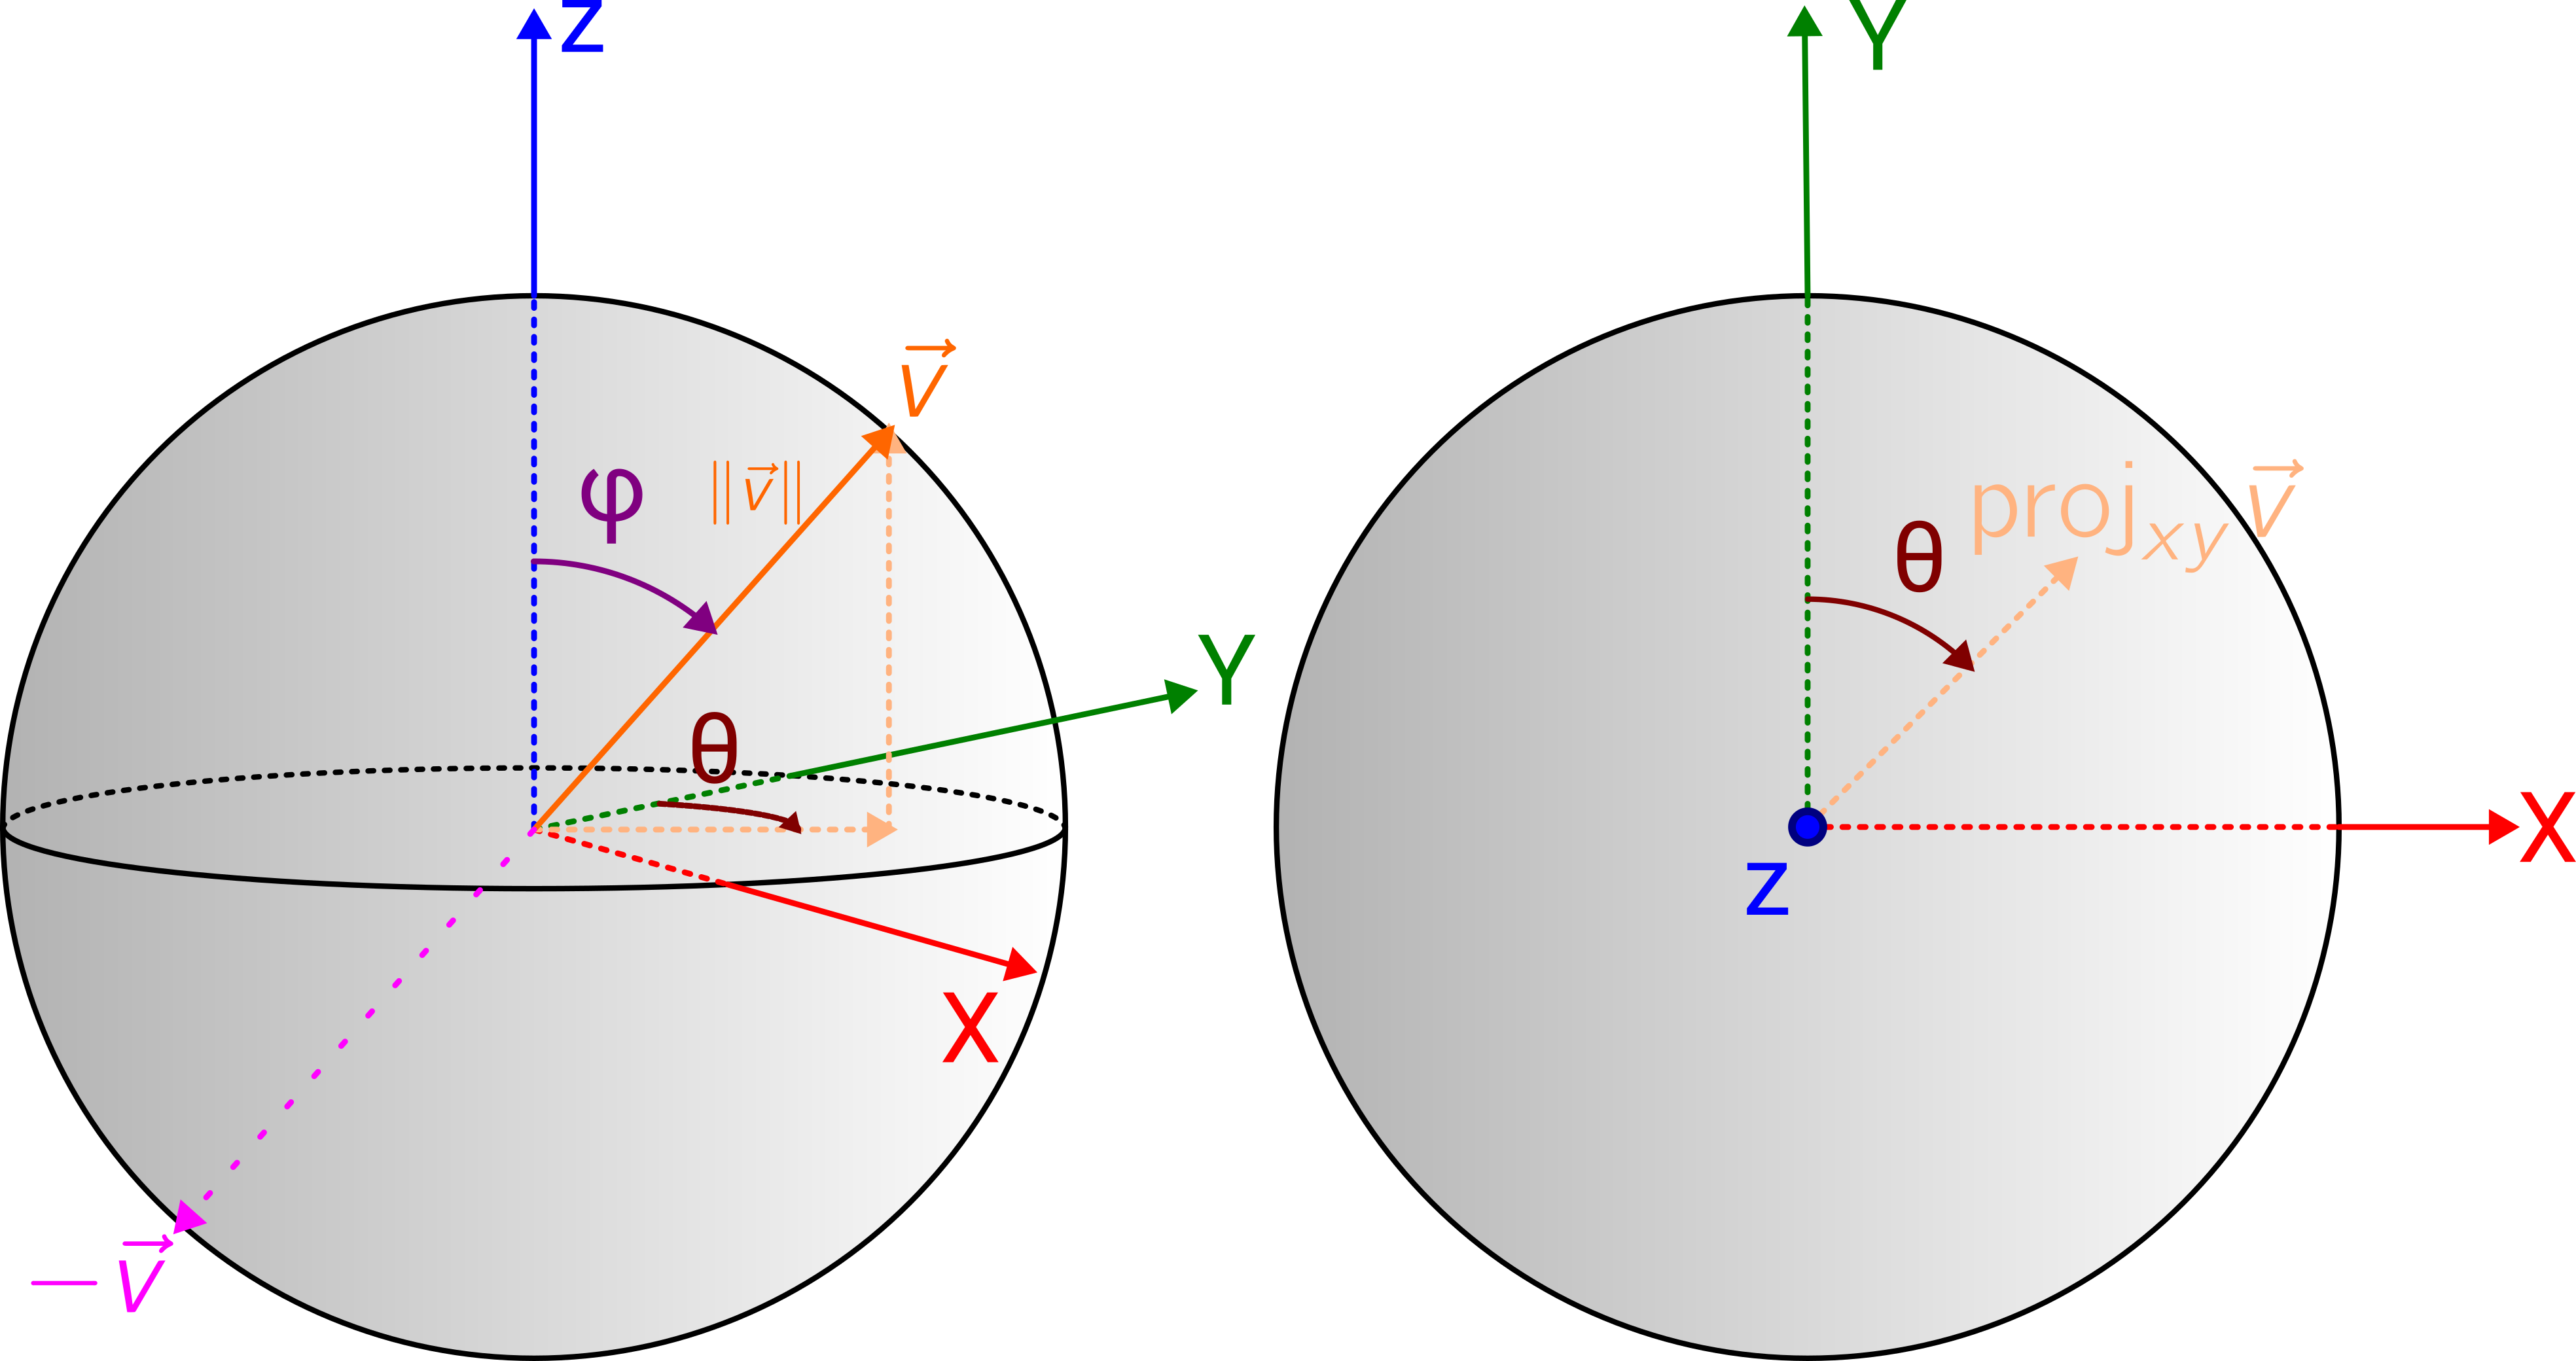
To analyse the magnitude and direction separately, we can use spherical coordinates. Any vector is represented using three numbers:
\(r\) - the vector magnitude.
\(\phi\) - the angle of inclination with respect to the positive z-axis, also known as the colatitude.
\(\theta\) - the azimuthal angle, clockwise with respect to the positive y-axis, similar to the longitude.
The value \(r\) fully represents the vector magnitude, while the angles \((\phi, \theta)\) together fully describe the direction.
Warning
To avoid having two representations for the same point, these angles are restricted to specific ranges, with \(0\leq\phi\leq180\) and \(0\leq\theta<360\). Note the different boundary conditions!
To convert the Cartesian representation to a spherical coordinates representation, we must compute these three values.
The magnitude is simply calculated as the vector norm. Thus, the magnitude of a 3D vector \(\vec{v}\) is calculated as:
where \(v_x,v_y,v_z\) are the respective x, y, z vector components.
The direction is represented by the \(\phi\) and \(\theta\) angles. These angles are computed from the Cartesian vector components using the following equations:
Warning
Unlike Cartesian coordinates, where definitions of \(x,y,z\) are quite universally agreed-upon, there are many possible definitions for the spherical coordinates. Our definition differs from that presented by Fisher et al. [1993] and we have modified any implemented equations to ensure consistency.
Vectors and Axes#
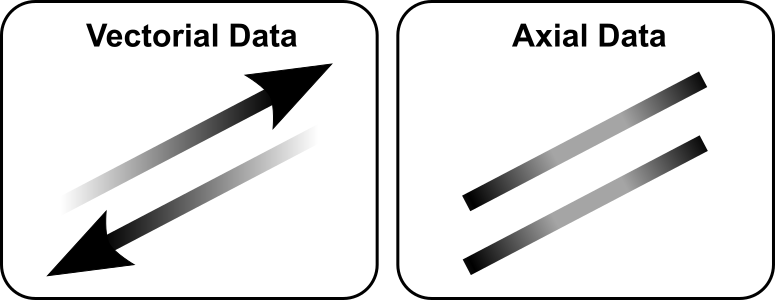
Before continuing, there is an important subtlety we must address. There are actually two common types of orientated data [Fisher et al., 1993]:
Vectorial data, represented as arrows, are pointed in a certain direction, which is distinct from the reverse direction.
Axial data, represented as lines, are aligned with a certain orientation, where forward and reverse are considered identical.
Confused? Hopefully, some examples and analogies will clarify.
Examples and Analogies#
As an analogy, let’s consider the difference between escalators and staircases. An escalator moves only up or down. Typically, if you are on the up escalator, you can only move up. You are restricted to a single direction. A down escalator provides motion in the distinct opposite direction. The escalator thus represents vectorial data.
In contrast, a staircase does not have this restriction. Stairs do not inherently move up or down [2] and thus only have an orientation (how the staircase is oriented in space) but no direction. The same staircase can be thought of as going both up and down with no preference. Stairs thus represent axial data.
Now, for some concrete examples. The wind discussed above is an example of vectorial data [see Klink, 1998]. Wind blowing east is quite different from wind blowing west.
Meanwhile, cardiac fibre orientation [Dileep et al., 2023, Lombaert et al., 2012] and bone trabecular anisotropy [Reznikov et al., 2022] are both examples of axial data. These structures are aligned in a certain spatial orientation, but don’t have a specified forward and reverse direction.
Important Terminology#
Now that those definitions are clear, let’s clarify some important terminology. We describe vectorial data as having a direction, while we describe axial data as having an orientation. Completely opposite directions, represented by antiparallel vectors, have the same orientation.
Mathematically, the \(\phi\) and \(\theta\) angles determining a direction cover the entire surface of a unit sphere. As antiparallel vectors have the same orientation, the \(\phi\) and \(\theta\) angles that describe an orientation are restricted to the upper half of the unit sphere. In this case, the angular ranges can be defined as \(0\leq\phi\leq90\) and \(0\leq\theta<360\).
Now that we have described vectorial and axial data, we can see how to load these data into VectoRose.